performance_testing_xgboost_on_htcf
performance_testing_xgboost_on_htcf.RmdApplication
We wish to do the following:
- extract data from a genomic feature by sample expression matrix
- extract data from a variant by variant label VCF style file
- convert this data into a modelling format
- clean and prepare this data – ie, deal with NAs, drop zero variance features from the model matrix
- train a model
- tune hyperparameters via grid search and n-fold cross validation
- Output the data for downstream processing
Current application requires this to be done over genes, which means that this process must be performed on 10,000 to 20,000 genes, up to 10x each for hyperparameter tuning/cross validation.
Goal
A flexible, repeatable, reproducible environment in which to explore the resource usage of various models in order to use efficiently the computing resources that we have available.
Questions and Answers
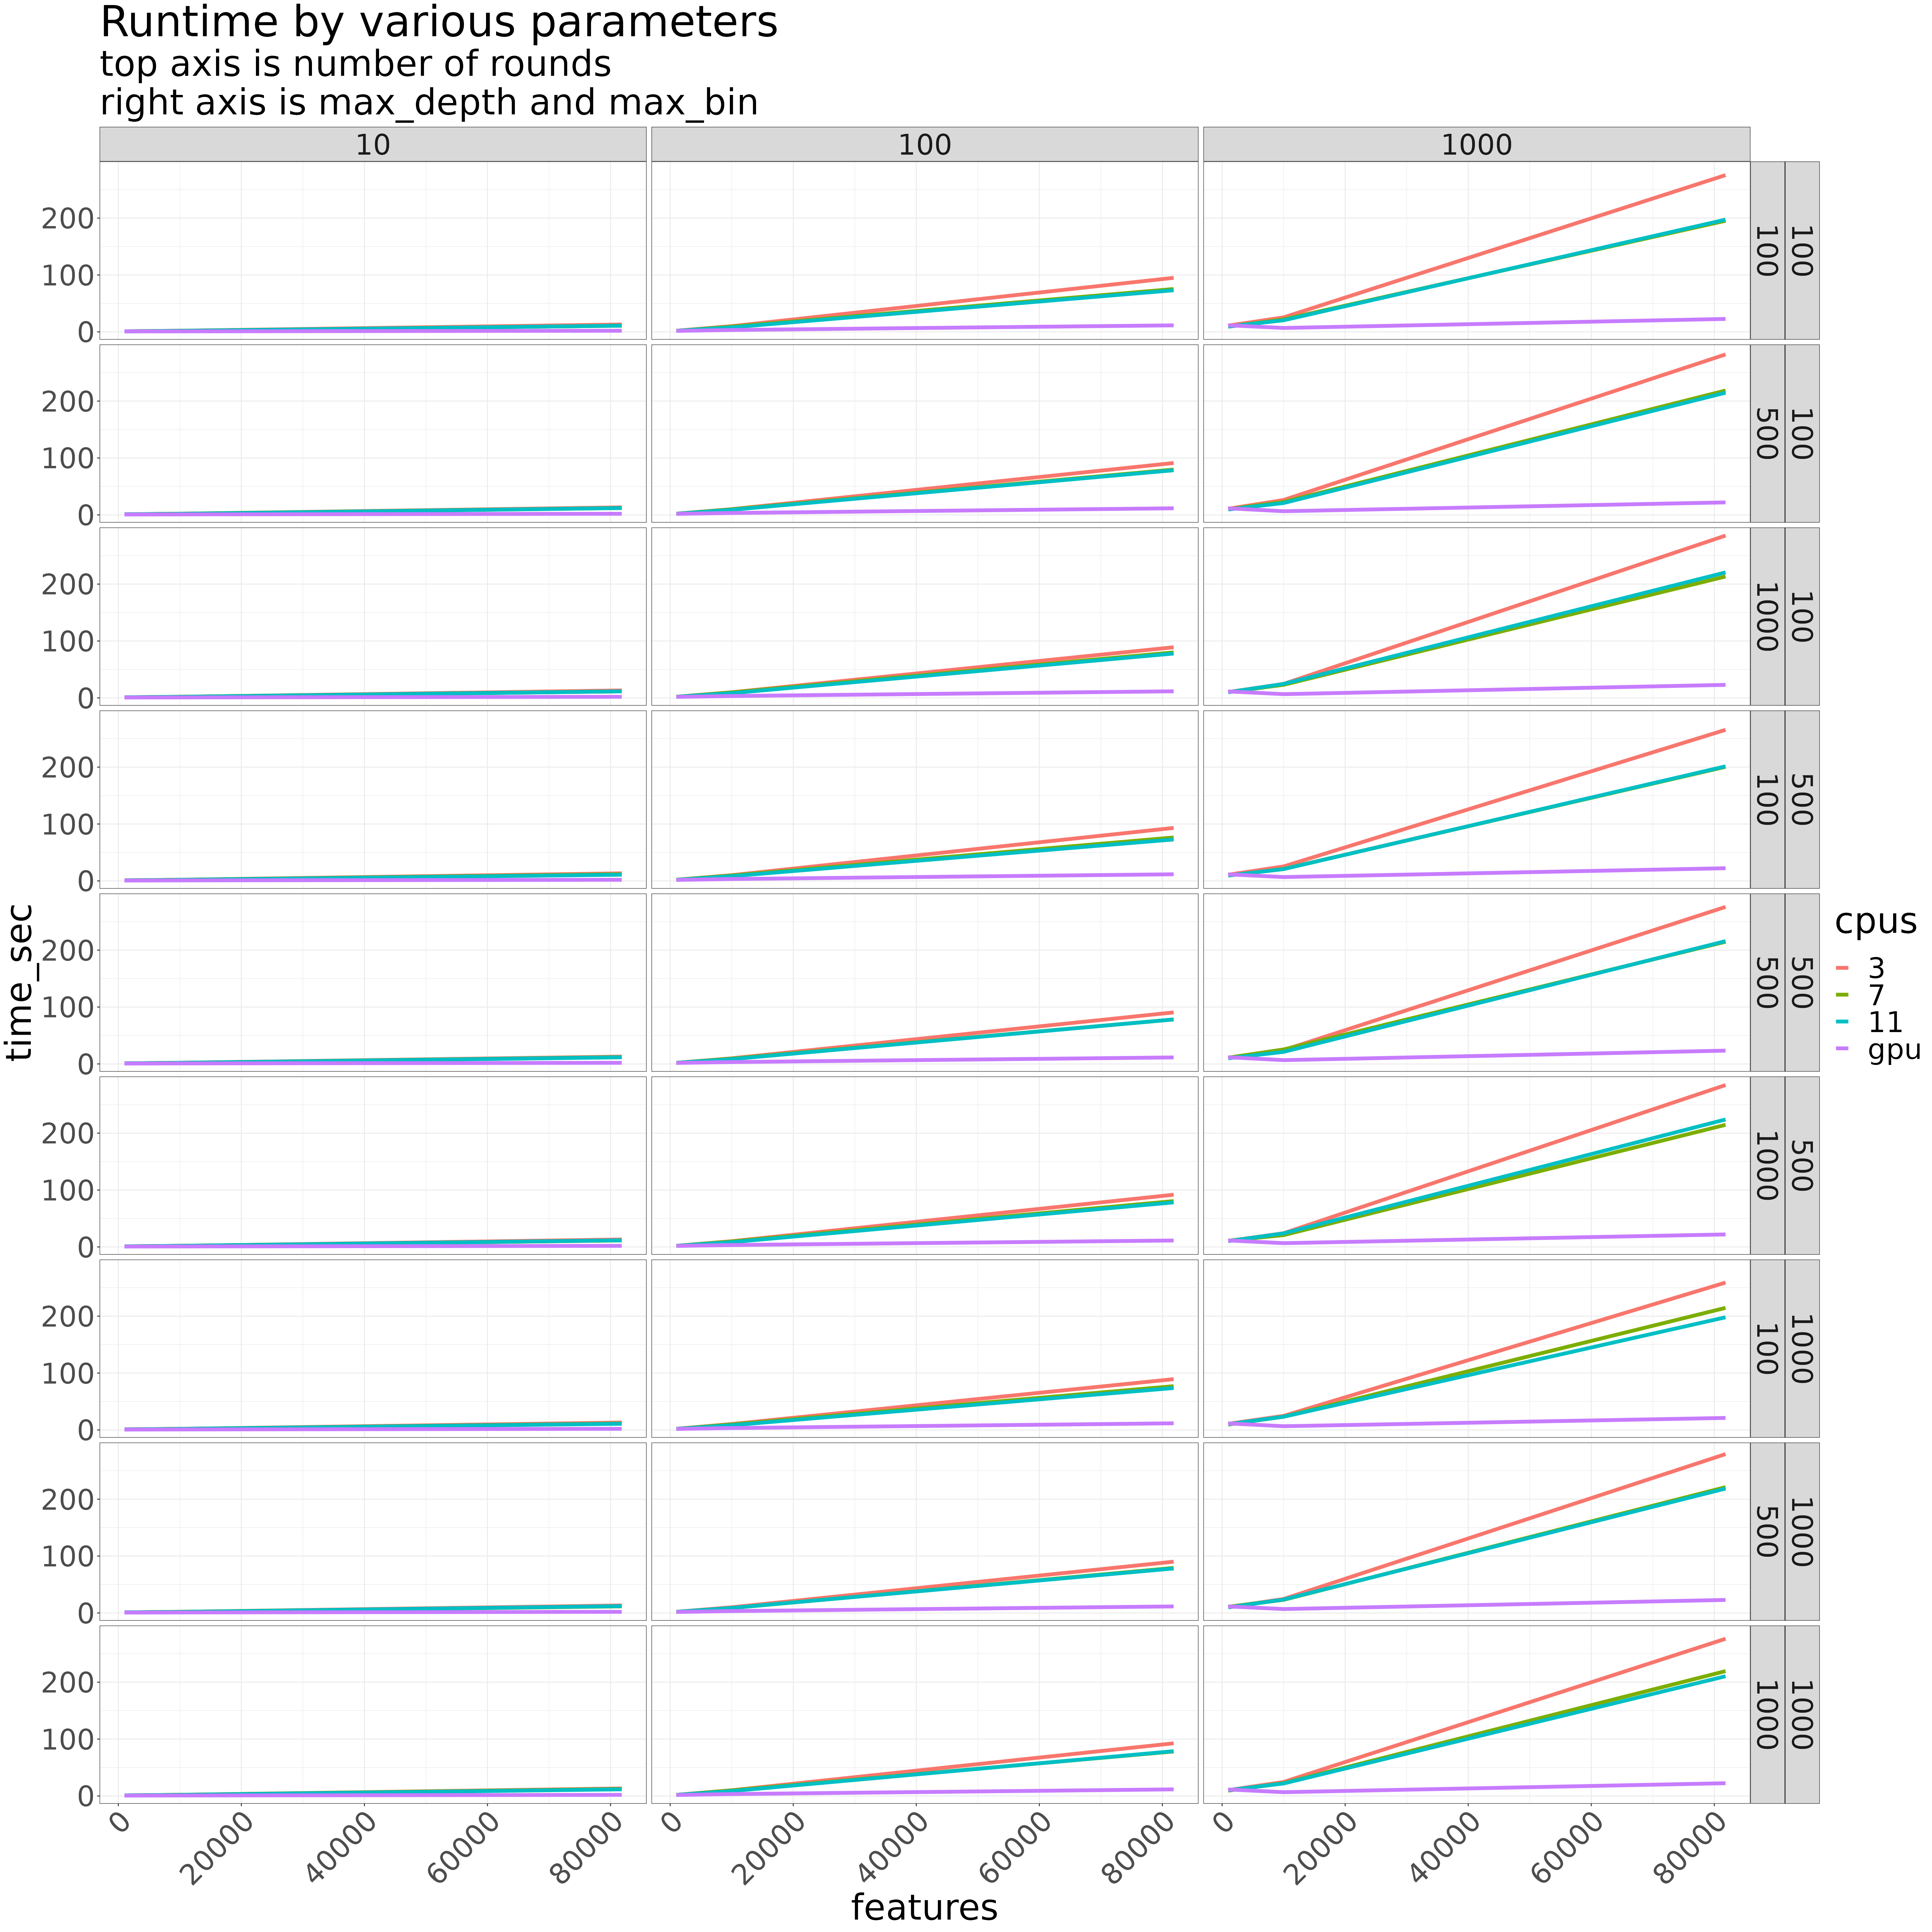
Which parameters most affect runtime and resource usage
Number of features of course most impact memory. However, this can be significantly reduced by using sparse matrix data representations when the underlying software can handle it. Average memory usage for the large model was around 4GB - 6GB. I opted for a 10GB SBATCH request.
The number of rounds had the greatest effect on runtime. For a given number of rounds, the number of features has the greatest impact. max_bin and max_depth had little to no impact.
With 7 CPUs, the runtime for a single model is about 3.6 minutes on my local. Interesting, there was more variability on the cluster.
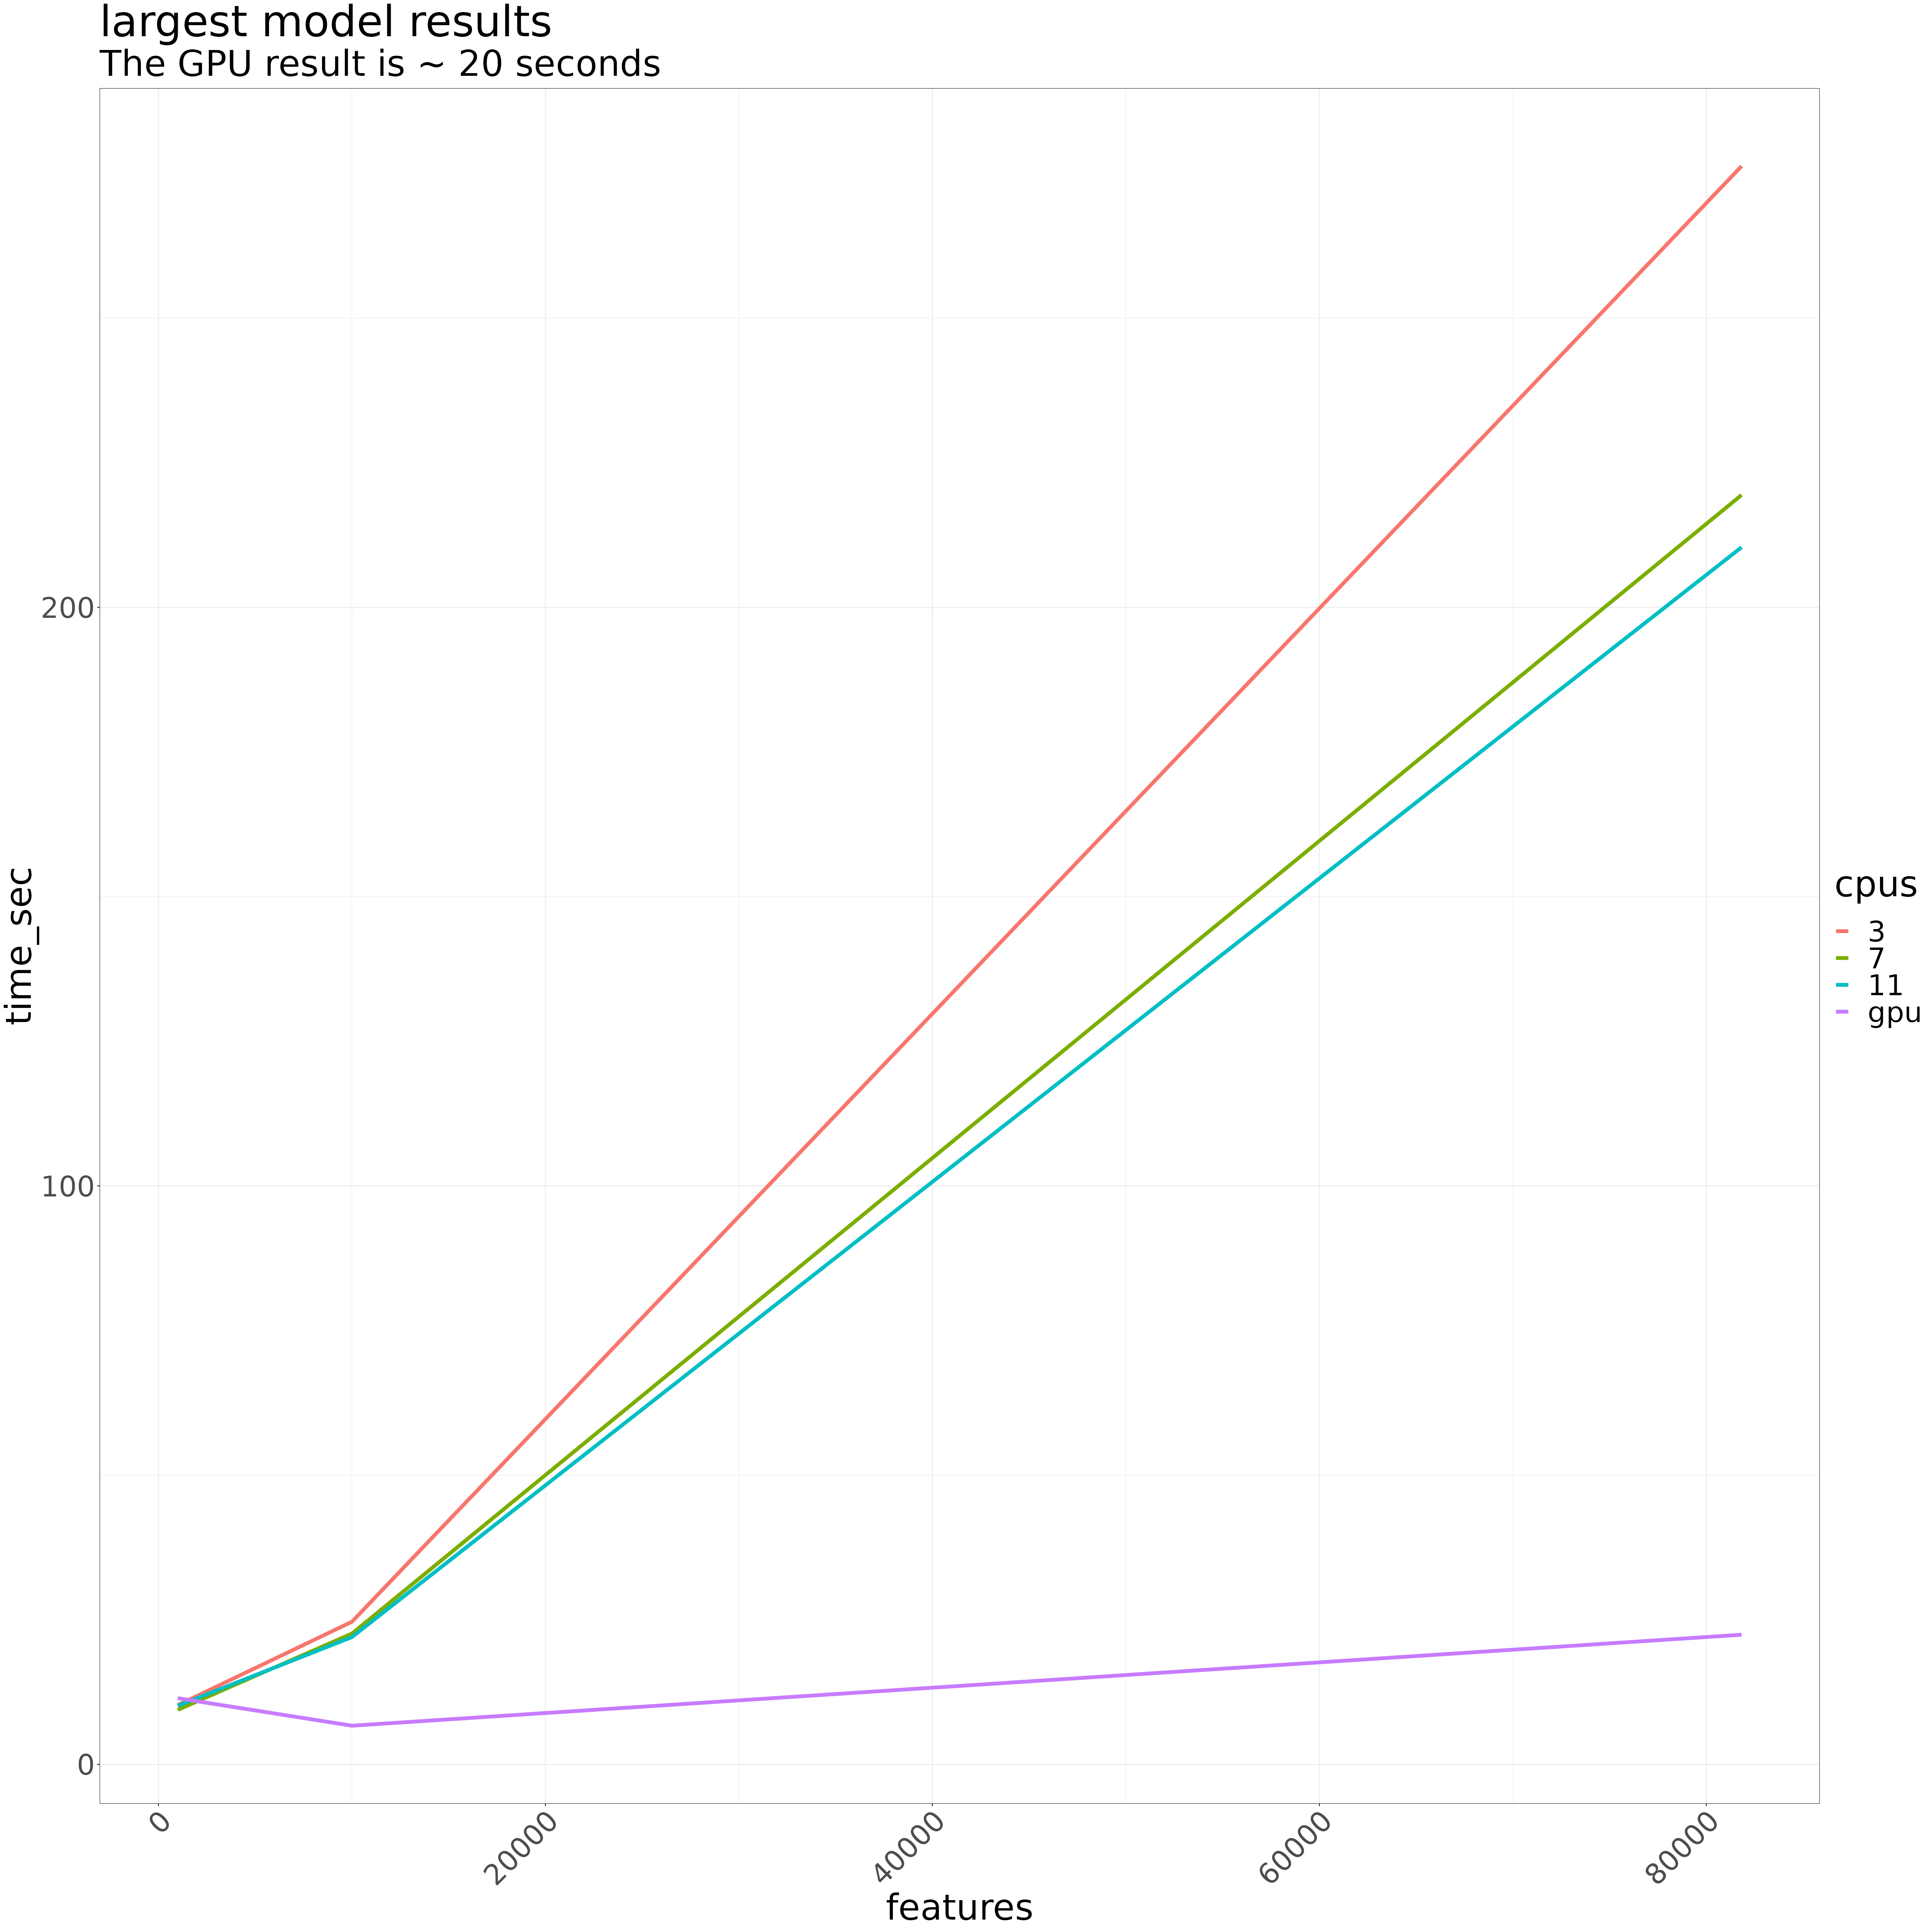
GPU execution on the cluster, on the same model and settings, took about 22 seconds. The GPU is therefore ~ 10x faster on a per model basis
What is the scheduling rate on the CPUs and GPUs on HTCF?
- CPUs
With 81k features, 1k rounds and max_depth and max_bin both set to 1000, the scheduling rate on the CPU is about 30 jobs per minute.
With a 10k feature model, 10k rounds, max_depth = 2 and the XGBoost default max_bin (256), the scheduling rate is 84 jobs per minute. This means that to do 10 fold cross validation on 20,000 genes, with no (statistical theory based) speed-ups from sharing data across folds (this is at least available in
caret, possiblyscikit-learn), the runtime would be about 1.6 days
- GPUs
The scheduling rate with 81k features and 1k rounds was 8.13 per minute when scheduling a typical array job (1 model per resource request). It occurred to me that since each model runs so much faster, it might be possible to speed up the runtime by ‘batching’ the jobs so that some number of models run sequentially per resource request. For instance, to run 1000 models, you would submit an array job of 100 tasks, and in each one of those 100 tasks, 10 models would run sequentially. However, this didn’t improve the per model execution rate – the result of 10 sequential tasks per submission was ~6 jobs per minute. This probably warrants further investigation, however there are a number options to speed up the CPU execution, already comparatively fast, which will be far easier to implement and result in easier to distribute software. Therefore, using the GPUs on the scale of HTCF to do genome scale work is very unlikely to have worthwhile returns in terms of runtime optimization.
Conclusion
For ‘full’ genomic scale tasks, due to the high level of concurrency that is afforded by so many CPUs on the general compute partition, it will generally be faster to use the CPUs. However, it is possible that by chunking jobs, so that multiple models run sequentially per resource request, that the runtime could be reduced by utilizing the GPUs for the modelling task.
For single to a small number of model tasks – eg, doing EDA on some genes with different expression characteristics, or exploring some of the outlier-y models from a full scale genome run – using the GPU will be ~ 10x faster than using the CPU. That said, the cluster isn’t your personal computer. Submit your jobs via sbatch. Don’t just sit on resources.
Details
Run time and memory on CPUs and GPU(s) – single gene model
parameters of interest which affect run time and memory usage:
- the number of features
- the number of trees
- the number of rounds
In each case, we want to vary either the number of CPUs, or run the models on the GPU(s).
Submission rate
The optimal CPU request seems to be between 3 and 7 CPUs. More than 7 offers significantly decreased improvement. Closer to 7 is likely best, but smaller resource requests typically increase job submission rate, which impacts concurrency – as we’ve seen, this has a huge impact on runtime. To test the submission rate on the cluster, I containerized the virtual environment (including this package), wrote a cmd line interface which can be accessed from the installed package like so:
system.file('xgboost_perf_testing.R', package = 'brentlabModelPerfTesting')Or in the inst directory in the github repo.
This is submitted like so for CPU execution
#!/bin/bash

#SBATCH --mem=10G
#SBATCH --cpus-per-task=8
#SBATCH --time=10
#SBATCH --job-name=rate_testing
#SBATCH --output=rate_testing.out

eval $(spack load --sh singularityce@3.8.0)

singularity_image=$1

run_script=/scratch/mblab/chasem/xgboost_testing/brentlabModelPerfTesting/inst/xgboost_pref_testing.R

rounds=10000
max_bin=256
max_depth=2

singularity exec \
  -B /scratch/mblab \
  -B "$PWD" \
  $singularity_image \
  /bin/bash -c "cd $PWD;
 $run_script --cpu 7 --rounds $rounds --max_bin $max_bin --max_depth $max_depth"
with the submission cmd
sbatch --array=1-1000 submit.sh ../software/brentlabxgboost_latest.sifTo test this on the GPU, only three items need be
changed on the SBATCH submission
- the resource requests
- the singularity flag
--nvmust be set - set the
--gpuflag in the cmd line script
#SBATCH -p gpu
#SBATCH --gpus=1
#SBATCH --mem=10G
#SBATCH --time=10
#SBATCH --job-name=rate_testing
#SBATCH --output=rate_testing.out

# ... same as above

# note that new --nv flag!
singularity exec \
  --nv  \
  -B /scratch/mblab \
  -B "$PWD" \
 $run_script --gpu --rounds $rounds --max_bin $max_bin --max_depth $max_depth"
It should be clear how to modify the sbatch submission to do a grid
search over, in this case, the parameters which affect run time and
memory usage. Just create a data.frame (expand.grid in R.
There
is a long discussion here on how to do the same in python. I’d check
numpy, too). However you do this, write it as a tsv:
cpu_testing_grid = expand.grid(
  features = c(1000,10000,ncol(gene_data)-1), # minus 1 since first col is response
  rounds = c(10,100,1000),
  max_depth  = c(100,500,1000),
  max_bin = c(100,500,1000),
  cpus = c(3,7,11)
)

write_tsv(cpu_testing_grid, "cpu_test_grid.tsv")
Include this line in the sbatch script above:
# replace $2 with the appropriate number of cmd line input, or the path to
# the lookup
read features rounds max_depth max_bin cpus < <(sed -n ${SLURM_ARRAY_TASK_ID}p "$2")
Submission Rate Results
CPU – 10k features, 10k rounds
[chasem@login xgboost_testing]$ sacct -j 2437829_1000 --format=end
2023-02-14T06:34:59

[chasem@login xgboost_testing]$ sacct -j 2437829_1 --format=submit
2023-02-14T06:23:05

[chasem@login xgboost_testing]$ date -d 2023-02-14T06:34:59 +%s
1676378099

[chasem@login xgboost_testing]$ date -d 2023-02-14T06:23:05  +%s
1676377385
This comes out to a submission rate of approximately 84 jobs/minute. To run this on 20,000 genes with 10 fold CV where each fold is performed separately without (stats theory based) data sharing speed ups, it would take approximately 1.6 days.
CPU – 81k features, 1k rounds
$ sacct -j 2409850_1000 --format=end
2023-02-12T21:33:06

$ sacct -j 2409850_1 --format=submit
2023-02-12T20:59:55

$ date -d 2023-02-12T21:33:06 +%s
1676259186

$ date -d 2023-02-12T20:59:55 +%s
1676257195
This comes out to a submission rate of approximately 30 jobs/minute. To run this on 20,000 genes with 10 fold cross validation where each fold is performed separately, this would take approximately 4.5 days at this rate.
GPU – a typical array: 10k features, 10k rounds, max_depth 2, max_bins default (256)
This is going to be hard to accept, but despite the fact that the GPU execution is ~10 times as fast per model, since there are only 6 GPUs, the scheduling rate is slower by quite a lot (about 10x slower). Note that I killed the array of 1000 after ~ 200 jobs had completed because the pattern was obvious, and I realized I needed less jobs to test the comparatively far smaller number of GPU
$ sacct -j 2448789_1 --format=submit
2023-02-14T21:32:21

$ sacct -j 2448789_200 --format=end
2023-02-14T21:56:57

$ date -d 2023-02-14T21:56:56 +%s
1676433416

$ date -d 2023-02-14T21:32:20 +%s
1676431940
This comes out to a submission rate of 8.13 jobs / minute
GPU – chunked array
It occurred to me that since each model executed so quickly, it might be better to run more models per resource request, so instead of submitting 1000 tasks separately, submit 100 tasks, each of which do 10 sequential tasks.
Model: 10k features, 10k rounds, max_depth 2, max_bin default (256)
$ sacct -j 2442699_100 --format=end
2023-02-14T15:46:58

$ sacct -j 2442699_1 --format=submit
2023-02-14T12:58:31

$ date -d 2023-02-14T15:46:58 +%s
1676411218

$ date -d 2023-02-14T12:58:31 +%s
1676401111
this comes out (on a per model basis) to 5.9 jobs / minute.
Follow-ons
None of the serious ‘modelling backends’ are implemented in R or python – packages in R and python provide interfaces to software typically written in a compiled language. For the ‘modelling backends’ which have both R and python interfaces, the choice of R or python for that specific task is arbitrary.
However, there are some features on which an informed choice can be made. These are listed below.
- Are there other tools available in one or the other platform which ease handling the data at hand?
- Does one of the classification and regression statistical learning packages perform better at the data storage/preparation steps than another? In this particular application, we have a large, sparse matrix – possibly there are frameworks in one software, but not others to handle this.
- Are there built-in parallelization tools which provide an easier path to scaling?
Specifically for XGBoost
There are (at least) two other implementations of the gradient boosting tree method that are worth benchmarking on this data against XGBoost:
LightGBM: Developed and maintained at Microsoft. It is benchmarked against XGBoost and is far faster
Catboost: Even faster than LightGLM, also claims higher performance than LightGLM and XGBoost
H20/GBM: Looks like this software had a name change. According to the Catboost benchmarks, H20 doesn’t perform as well. It has some serious developers behind it, though. Worth checking out. H20 also includes other ML algorithms.
Caret, tidymodels and scikit-learn
There are two well developed statistical learning softwares in R which focus on the not-neural-nets: caret and the comparatively newer tidymodels. Remember that no real computation software is written in R or python – these are interfaces – so the neural-net softwares are largely also available in R, though they seem to be more popularly used in python.
In python, a comparable package to caret and tidymodels is scikit-learn.
These softwares provide structures and functions which facilitate doing the following common modelling tasks:
- data preparation
- test/train split
- model selection and evaluation
- hyperparameter tuning
- cross validation
- feature selection
- … and more, like drop in parallelization on various back ends
Each provides an interface to a large number of ‘modelling backends’, ie xgboost, adaboost, catboost, fastglm, … . All of these are available at the change of a switch and may be easily compared to one another both in modelling performance and resource usage. These softwares also provide built-in performance enhancers, eg minimizing work in n-fold CV where it is possible by sharing data.
It would be foolish not to rule these out before starting a coding task – the time commitment to learn one or all of them will pay off in the ability to do far more with far less effort.